

Who Will Observe the Observability? eBPF Performance at Scale
Why infrastructure teams can't afford to be passengers, even in managed Kubernetes

From KubeCon Stage to Technical Deep-Dive
After my KubeCon talk with Grzegorz Głąb, “Fix First, Investigate Later: When an eBPF Rollout Brought Down Our Network,” I received numerous questions. While many wanted to discuss the specific technicalities of the incident, a distinct pattern emerged in the “hallway.” People weren’t just asking how the bug happened. They were also interested in: “What kind of skills does a Infrastructure Team actually need to own this stack?”
The conversation shifted from the specifics of the incident to the capability of the team solving it. It raised a fundamental question: What is the gradient of expertise required today?
The Illusion of “Managed” Systems
There is no short answer to “what skills do we need?” but there is a mindset shift required regarding the infrastructure we rent. Too many organizations fall into the trap of treating managed Kubernetes services as black boxes. We convince ourselves that because we pay a premium for a managed control plane, the underlying compute is “someone else’s problem.”
But if your business continuity relies on these foundational systems, you cannot afford to be a passenger. Even in managed environments, you almost always have full access to the worker node VMs. There is nothing actually stopping us from building the expertise to debug them.
This depth of expertise is where an infrastructure team differentiates itself. It is the difference between the “Folklore Team” (”Just restart the node, that usually fixes it”) and the “Engineering Team” (”We identified a race condition in the CNI plugin...”).
Let’s take the technical findings from our KubeCon talk as a case study. Much like the deep dive into the irqbalance issue revealed, this investigation required us to look past the abstractions. It wasn’t just a matter of reading logs. It required digging into the kernel’s data transfer mechanisms to understand the root cause.
In fact, the deep dive I’m about to share happened much later, during personal time, driven by curiosity to reproduce and fully understand the issue. Since there were no direct business metrics attached to the specific root cause initially, limited organizational effort was allocated to it. It took that curiosity to go back and find the why.
The Hidden Challenge: Scaling eBPF on 32+ Core Systems
While eBPF programs promise minimal overhead, the reality on high-core-count machines under production traffic patterns tells a different story. Our investigation into Microsoft Retina’s packetparser plugin revealed a critical scaling bottleneck: when multi-core applications generate high traffic volumes across 32, 64, or 96 cores, the choice between perf arrays and ring buffers becomes critical.
Under real-world traffic patterns, where packet processing spreads across all cores simultaneously, perf arrays can degrade performance by up to 50%, while ring buffers maintain a more consistent 7% overhead. The difference becomes especially pronounced as traffic patterns shift from single-core bursts to sustained multi-core loads, turning what should be lightweight observability into a production-impacting bottleneck.
Understanding the Architecture: Retina’s Packetparser
Let’s examine how modern eBPF observability tools transfer data from kernel to user space, using Microsoft Retina as our case study. Retina’s packetparser plugin showcases a common architecture in eBPF network monitoring:
The eBPF Programs
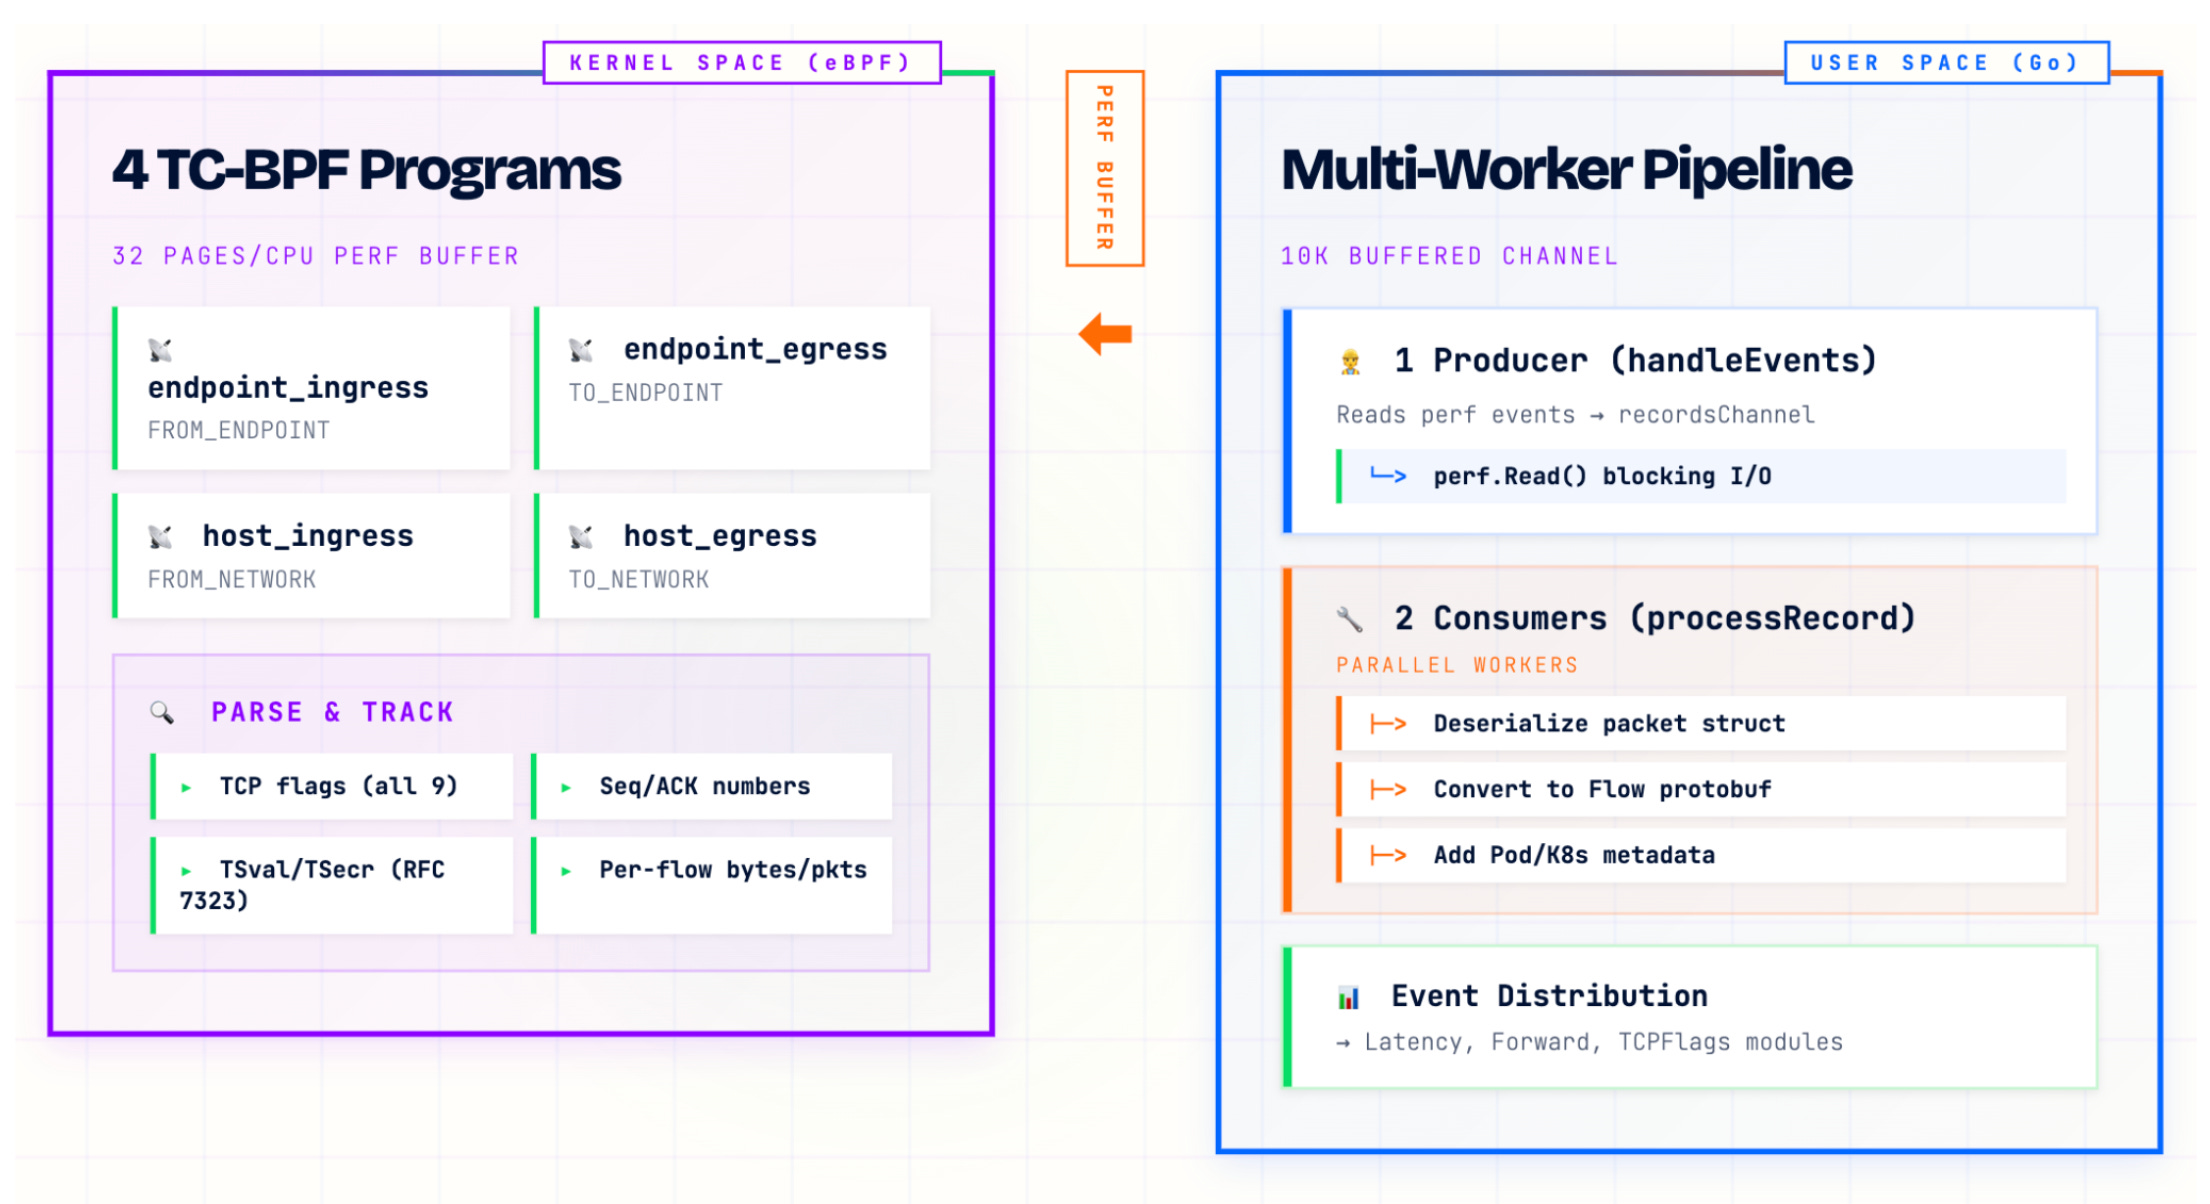
Packetparser deploys four TC-BPF programs:
endpoint_ingress/egress: Attached to pod interfaces
host_ingress/egress: Monitoring host network interfaces
These programs perform packet analysis:
Parse TCP flags (all 9 bits)
Track TSval/TSecr for RTT calculation (RFC 7323)
Monitor sequence/ACK numbers
Calculate per-flow metrics (bytes/packets)
But the real challenge isn’t in the kernel, it’s in getting this data to user space efficiently.
Perf Arrays: The Traditional Approach
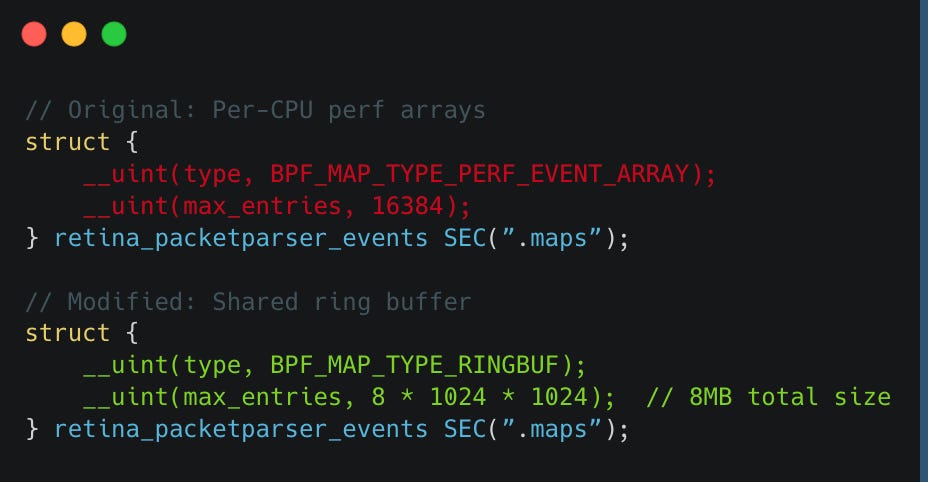
Most eBPF tools default to perf arrays (BPF_MAP_TYPE_PERF_EVENT_ARRAY) for kernel-to-user communication. Here’s why this made sense initially, and why it breaks down at scale.
How Perf Arrays Work
Perf arrays create a per-CPU buffer architecture:
32 CPU Cores = 32 Independent Buffers
Each buffer: 32 pages (131KB)
Total memory: ~4MB across all CPUs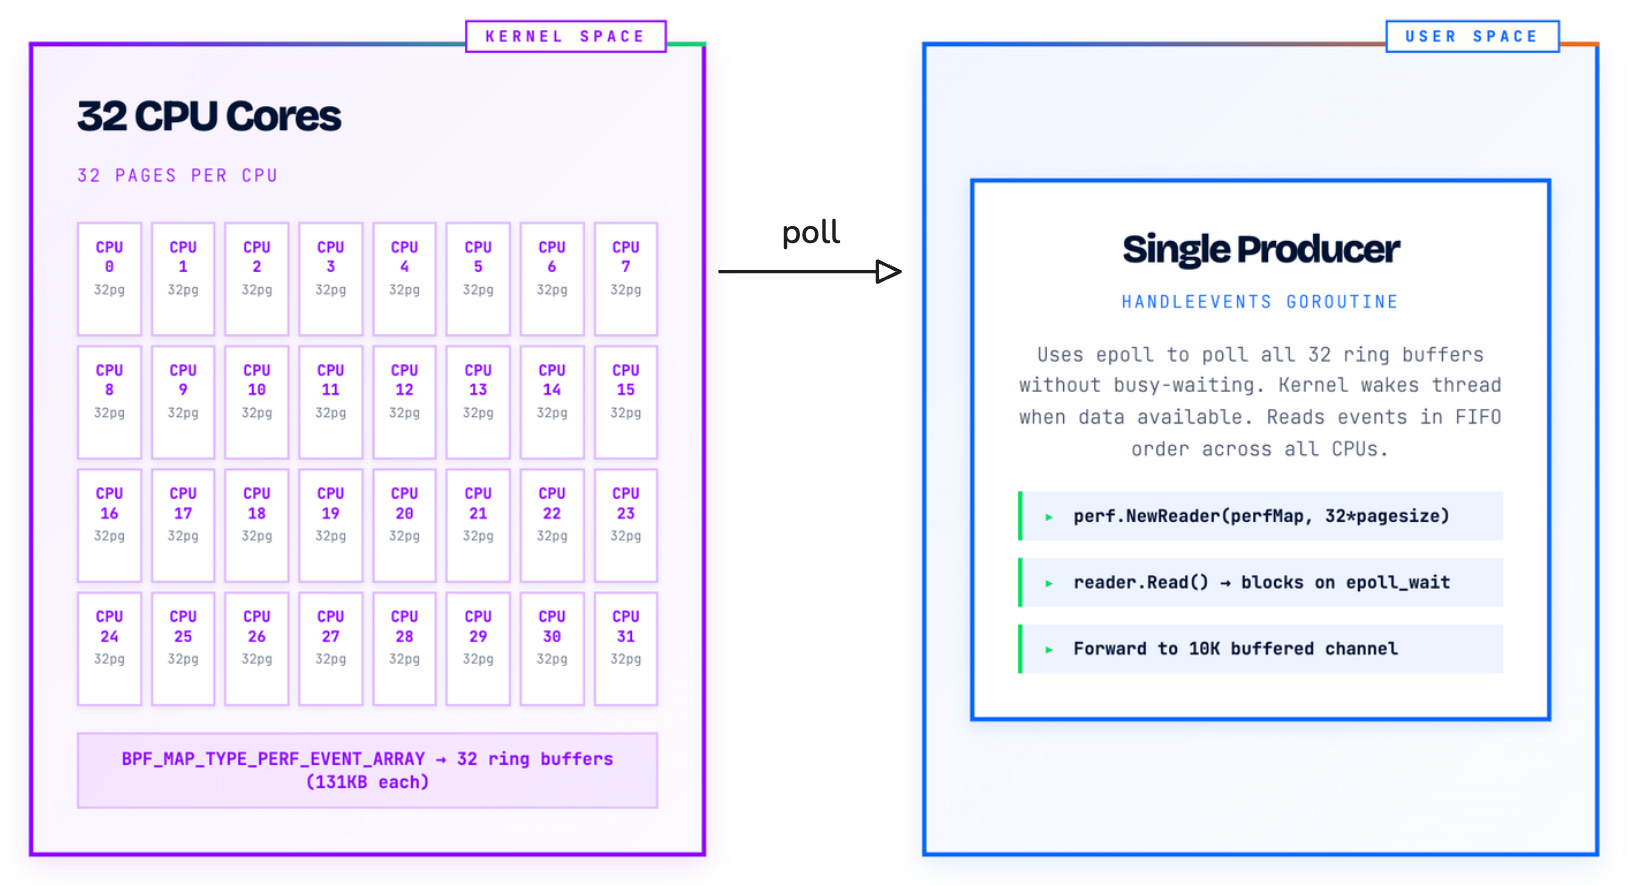
The data flow follows this pattern:
Each CPU writes events to its dedicated buffer (Kernel “Producer”)
A single reader goroutine polls all buffers via epoll (User Space “Consumer”)
The reader consumes events in FIFO order across all CPUs
Events are forwarded to consumer workers through channels
This architecture seems reasonable. It avoids lock contention by giving each CPU its own buffer. But our benchmarks revealed a critical scaling problem.
Reproducing the Multi-Core Storm
To validate our hypothesis, we needed to simulate the traffic patterns that trigger this bottleneck. And that’s where standard tools fell short. iperf3, the go-to for network benchmarking, is single-threaded by default. It generates impressive throughput numbers, but all that traffic flows through a single core, completely missing the multi-core contention pattern we observed in production.
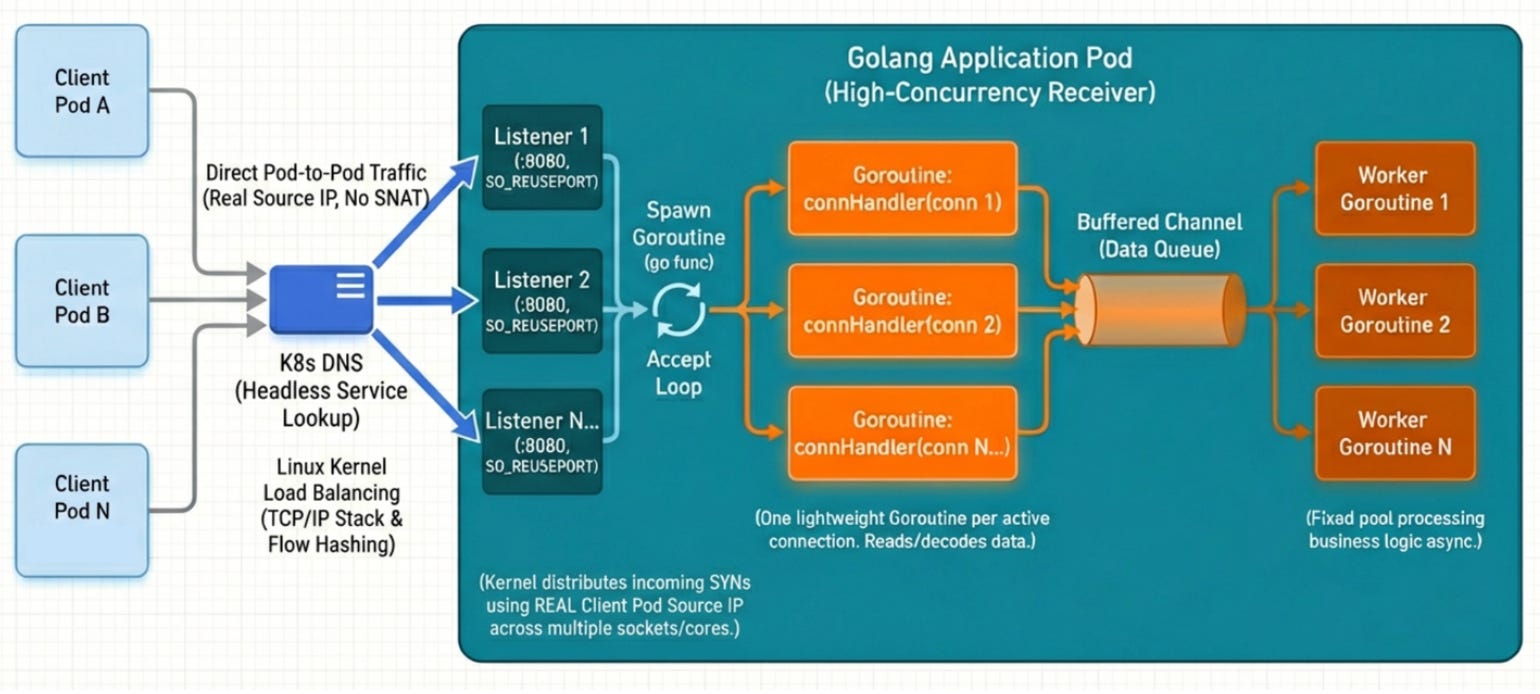
So we built a purpose-designed Go application to replicate a real-world, network-intensive workload. The architecture leverages SO_REUSEPORT to bind multiple listeners to the same port, allowing the Linux kernel to distribute incoming SYN packets across sockets using flow hashing on the real client pod source IPs. Each accepted connection spawns a lightweight goroutine for reading and decoding, feeding work into a buffered channel consumed by a fixed worker pool. This design ensures that when we spin up dozens of client pods hammering the receiver, we’re genuinely spreading packet processing across all available cores, exactly the scenario where eBPF’s data transfer path becomes the bottleneck rather than the application itself.
The Benchmark Results: A Non-Linear Degradation
We tested network throughput using this multi-threaded network receiver app on VM types with varying core counts. The results showed a disturbing trend: the more powerful the machine, the worse the relative performance overhead.
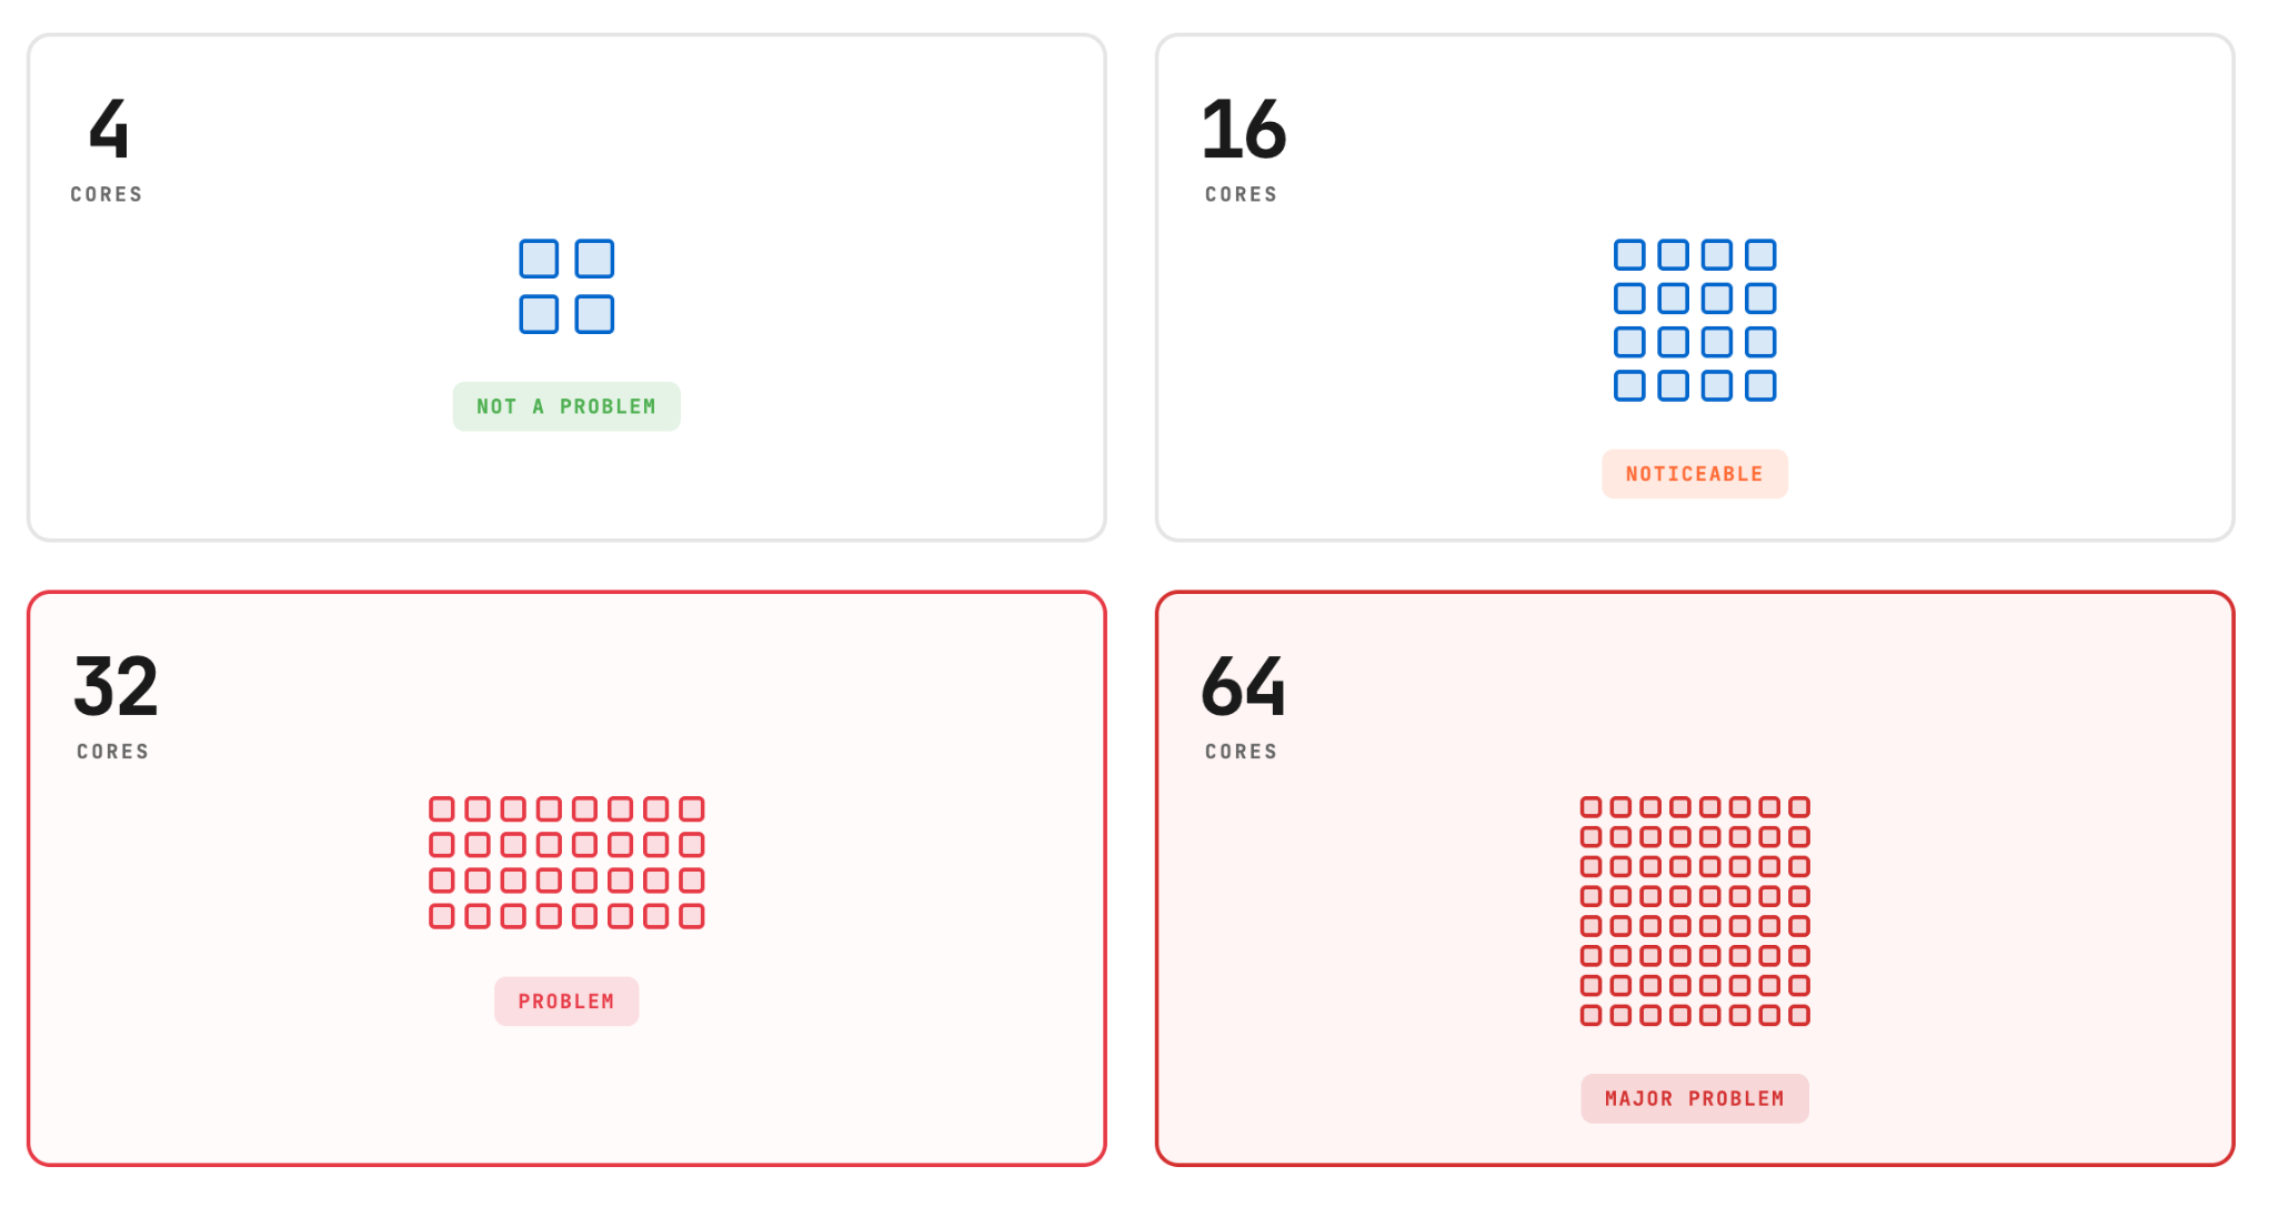
Performance Impact by Core Count:

4-core nodes:
  - Baseline:     200 Mb/s
  - With Retina:  200 Mb/s (0% impact)

16-core nodes:
  - Baseline:     5 Gb/s
  - With Retina:  4.3 Gb/s (14% reduction)

32-core nodes:
  - Baseline:     8.0 Gb/s
  - With Retina:  4.5 Gb/s (44% reduction)
On small nodes (4 cores), the overhead was negligible. By the time we reached 64 cores, the observability tool was choking nearly 50% of the available network throughput capacity.
Deep Dive: CPU Limits & Pinning
When we started the investigation in the performance drop on 32-core nodes, our immediate hypothesis was CPU throttling. We assumed the eBPF agent was hitting its Kubernetes resource limits. To test this, we ran a series of comparative benchmarks specifically on the 32-core nodes.
The results were counter-intuitive and highlighted the “thrashing” behavior of perf arrays:
Network Throughput Comparison (32-core Node)
Scenario	Throughput	Throughput
Without Retina (Baseline)	8.0 Gb/s	-	Clean baseline
With Retina (Default)	4.5 Gb/s	-43%	Standard deployment
Retina (No CPU Limits)	3.7 Gb/s	-53%	Performance worsened!
Retina (CPU Pinning)	5.2 Gb/s	-35%	Best case for Perf Arrays
Why did removing CPU limits make it worse?
Seeing performance drop from 4.5 Gb/s to 3.7 Gb/s after removing CPU limits (the “Without Limits” bar) was a surprise.
This revealed that the bottleneck wasn’t a lack of CPU cycles, but scheduling contention.
Thrashing: With unlimited CPU, the reader thread spun more aggressively, polling the 32 buffers.
Context Switching: This generated excessive context switches (>120k/sec).
The Effect of CPU Pinning
When we applied CPU pinning (isolating the Retina agent to specific cores), throughput improved to 5.2 Gb/s. While this was better than the default configuration, it still represented a 35% performance penalty compared to the baseline. We can do this via CPUManager static policy in kubernetes.
Even with perfect CPU isolation, the architectural overhead of polling 32 separate memory regions via Perf Arrays prevented us from reaching acceptable performance.
Look at the CPU usage pattern
With our reproducible pattern, we saw that the more cores we used and the more network-intensive the machines were, the higher the degradation was.
This made us look into again which part is actually changing with CPU core count.
Debugging eBPF related Degradation
We just analyzed a specific CPU usage pattern using our reproducible test environment. We observed a distinct correlation: as we increased the number of cores on nodes running network-intensive workloads, the performance degradation became more severe.
This led us to investigate which components were scaling poorly with the CPU core count. Let’s go down the debugging path.
First, we checked the loaded BPF programs to identify potential overhead. We will use just one as an example.
bpftool prog list

...
1167: sched_cls  name endpoint_ingress_filter  tag 44b14ea77164570a  gpl
	loaded_at 2025-11-23T19:06:46+0000  uid 0
	xlated 10480B  jited 7222B  memlock 12288B  map_ids 268,282
	btf_id 391
...
All we needed from the command above was the map_ids. We took a closer look at map 282.
bpftool map show id 282

282: perf_event_array  name retina_packetpa  flags 0x0
	key 4B  value 4B  max_entries 16  memlock 512B
It was a perf_event_array. To understand its impact, we decided to check the event frequency. We ran a bpftrace script to compare perf_event_output (streams) against perf_event_wakeup (wakeups).
timeout 10 sudo bpftrace -e ‘
  BEGIN {
    printf(”Timestamp | Streams/s | Wakeups/s\n”);
    printf(”----------------------------------\n”);
  }

  kprobe:perf_event_output {
    @streams = @streams + 1;
  }

  kprobe:perf_event_wakeup {
    @wakeups = @wakeups + 1;
  }

  interval:s:2 {
    printf(”%s | %9d | %9d\n”,
           strftime(”%H:%M:%S”, nsecs),
           @streams / 2,
           @wakeups / 2);

    @streams = 0;
    @wakeups = 0;
  }
‘
Attaching 4 probes...
Timestamp | Streams/s | Wakeups/s
----------------------------------
19:43:31 |     84883 |     62328
19:43:33 |     91055 |     65034
19:43:35 |     94762 |     69747
19:43:37 |     94825 |     69257

@streams: 171695
@wakeups: 115786
The results showed almost 70% of events resulting in a wakeup, which is significant.
To confirm the source, we asked: What happens if we disable Retina? How much of this percentage actually belongs to retina-agent? We ran the same probe with Retina disabled.
timeout 10 sudo bpftrace -e ‘
  BEGIN {
    printf(”Timestamp | Streams/s | Wakeups/s\n”);
    printf(”----------------------------------\n”);
  }

  kprobe:perf_event_output {
    @streams = @streams + 1;
  }

  kprobe:perf_event_wakeup {
    @wakeups = @wakeups + 1;
  }

  interval:s:2 {
    printf(”%s | %9d | %9d\n”,
           strftime(”%H:%M:%S”, nsecs),
           @streams / 2,
           @wakeups / 2);

    @streams = 0;
    @wakeups = 0;
  }
‘
Attaching 4 probes...
Timestamp | Streams/s | Wakeups/s
----------------------------------
19:44:43 |         0 |         0
19:44:45 |         0 |         0
19:44:47 |         0 |         0
19:44:49 |         0 |         0


@streams: 0
@wakeups: 0
The answer was clear: All of it. Every recorded event was coming due to Retina running on our node.
We were able to identify the per-cpu perf arrays as the culprit relatively quickly. By simply following the BPF program thread.
So, what does this mean for our packetparser architecture?
We were running not just one, but four TC BPF programs simultaneously. As the data demonstrates, relying heavily on per-CPU perf arrays can lead to extreme noise. The overhead incurred by these wakeups creates significant pressure on the system, explaining why the degradation worsened with increased core counts and network load.
Why Perf Arrays Break at Scale
The bottleneck emerges from a fundamental architectural constraint: buffer polling management.
Consider what happens on a 32-core system under high network load:
The single reader thread must manage file descriptors for 32 separate buffers.
Unlike a shared buffer, this requires iterating over multiple non-contiguous memory regions.
NUMA Penalties: On multi-socket systems (common in 32+ core VMs), the user-space reader typically runs on one NUMA node but must access memory pages allocated on remote NUMA nodes to drain the per-CPU buffers. This leads to cache line bouncing and expensive remote memory access.
Ring Buffers: A Different Approach
In kernel 5.8, BPF ring buffers (BPF_MAP_TYPE_RINGBUF) introduced a fundamentally different architecture. Instead of per-CPU isolation, ring buffers use a single shared data structure.
Ring Buffer Architecture
All CPUs → Single Shared Buffer (8MB)
          ↓
    [Spinlock coordination]
          ↓
    Single Consumer Read Point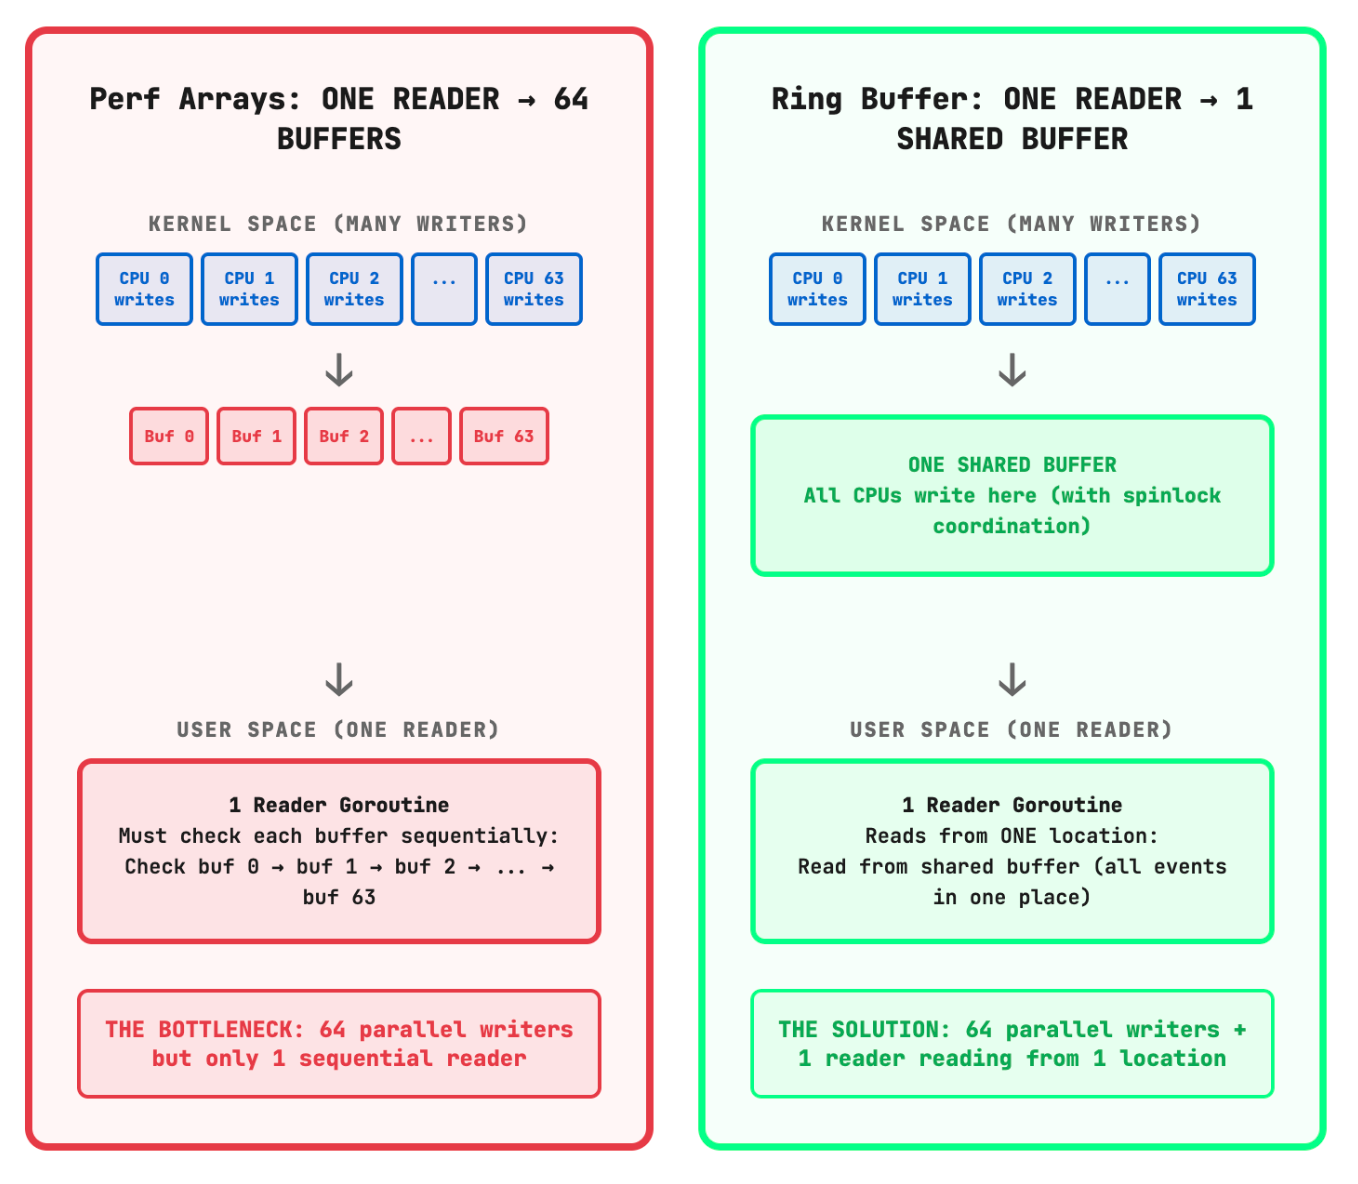
Key differences from perf arrays:
Multi-producer, single-consumer design
Lock-free for readers (spinlock only for writers)
Efficient Batching - consume events from all CPUs in one contiguous memory pass
Adaptive sizing - independent of CPU count
Implementation and Testing
To address this, we modified Retina to support ring buffers.
To verify the fix, we ran the same steps as above. First, we inspected the map again:
bpftool map show id 455
455: ringbuf  name retina_packetpa  flags 0x0
	key 0B  value 0B  max_entries 8388608  memlock 8434072B
This time, instead of a perf_event_array, we see a ringbuf.
Next, we double-checked that perf_event_wakeup events were eliminated by running our tracing script again.
Timestamp | Streams/s | Wakeups/s
----------------------------------
19:59:27 |         0 |         0
19:59:29 |         0 |         0
19:59:31 |         0 |         0
19:59:33 |         0 |         0


@streams: 0
@wakeups: 0
The results confirmed it, the specific noise from the perf event array is completely gone. Let’s now run some tests.
Benchmark Results: Ring Buffer Performance
After implementing ring buffer support, we repeated our benchmarks on the same 32-core nodes that struggled with Perf Arrays:
Network Throughput Comparison (32-core nodes):
- Baseline (no Retina):         8.0 Gb/s
- With Perf Arrays (Pinned):    5.2 Gb/s (35% overhead)
- With Ring Buffer:             7.4 Gb/s (7.5% overhead)
The improvement was dramatic. We reduced overhead from 35% to 7.5%. This validated our hypothesis: on high-core-count systems under sustained multi-core load, the data structure choice fundamentally determines whether eBPF observability remains transparent or becomes a production bottleneck.
Trade-offs and Considerations
Ring buffers aren’t universally better. Here’s what we learned:
When Perf Arrays Win:
Low core counts (≤8 cores)
Strict per-CPU isolation requirements
Older kernels (pre-5.8)
NUMA-sensitive workloads (specifically where kernel-side write latency is the priority over user-side read latency)
When Ring Buffers Win:
High core counts (≥16 cores)
Bursty traffic patterns
Limited consumer threads
Memory-constrained environments
The State of eBPF Observability: Looking Forward
Our investigation highlights a critical gap in the eBPF ecosystem: most tools are optimized for modest systems but deployed on increasingly powerful hardware.
Recommendations for Tool Developers
Make buffer mechanisms configurable: Don’t hardcode perf arrays or ring buffers
Test on production-representative hardware: If users run 32+ cores, test on 32+ cores
Document scaling characteristics: Be transparent about performance at different scales
Provide escape hatches: Quick ways to disable or tune down collection
The Future: Adaptive Mechanisms
The ideal eBPF observability tool would:
Auto-detect system characteristics (CPU count, NUMA topology)
Dynamically switch buffer mechanisms based on load
Implement backpressure when overwhelmed
Gracefully degrade (do sampling) rather than impact workload performance
Conclusion: Renters vs. Owners
This investigation highlights why the choice of buffer mechanism “Perf Arrays vs. Ring Buffers” isn’t just an implementation detail. It defines the scalability of your observability stack.
But more importantly, it brings us back to the question raised in the hallway: Why does a infrastrcuture team need to know the kernel stack if they are just “renting” the cloud?
Because when you run at scale, the abstraction leaks. If we had stayed in the “renter” mindset, we opened a support ticket. And to say the least, no one acknowledged this as a problem to start with. The vendor or cloud provider will look at the saturation and point the finger back at you, claiming it is your rogue workload causing the issue.
They wouldn’t be entirely wrong, your workload is high-traffic. But the degradation isn’t the workload’s fault. It’s the observability tool struggling to observe it. If you view yourself merely as a renter, you accept the degradation. If you view yourself as an engineer owning the stack, you investigate, you debug, and you fix.
Questions or experiences to share? reach out on LinkedIn.
References
Acknowledgments
Thanks to Grzegorz Głąb (Whatnot) for co-presenting at KubeCon. Reach out to him for any questions related to the first part of our KubeCon presentation on mutation webhook magic.
Thanks to Matthew Fowle for suggesting the title of blogpost: “Who will observe the observability?”